London, August 1854. The summer was suffocating and the smell of Soho, unbearable.
In the narrow streets, the silence was broken only by the crying of families and the sound of carts carrying bodies. Cholera was decimating the neighborhood. The authorities, stuck to old dogmas, blamed the “miasma” — the bad air. They looked at the sky, searching for poisonous clouds.
But Dr. John Snow looked at the ground.
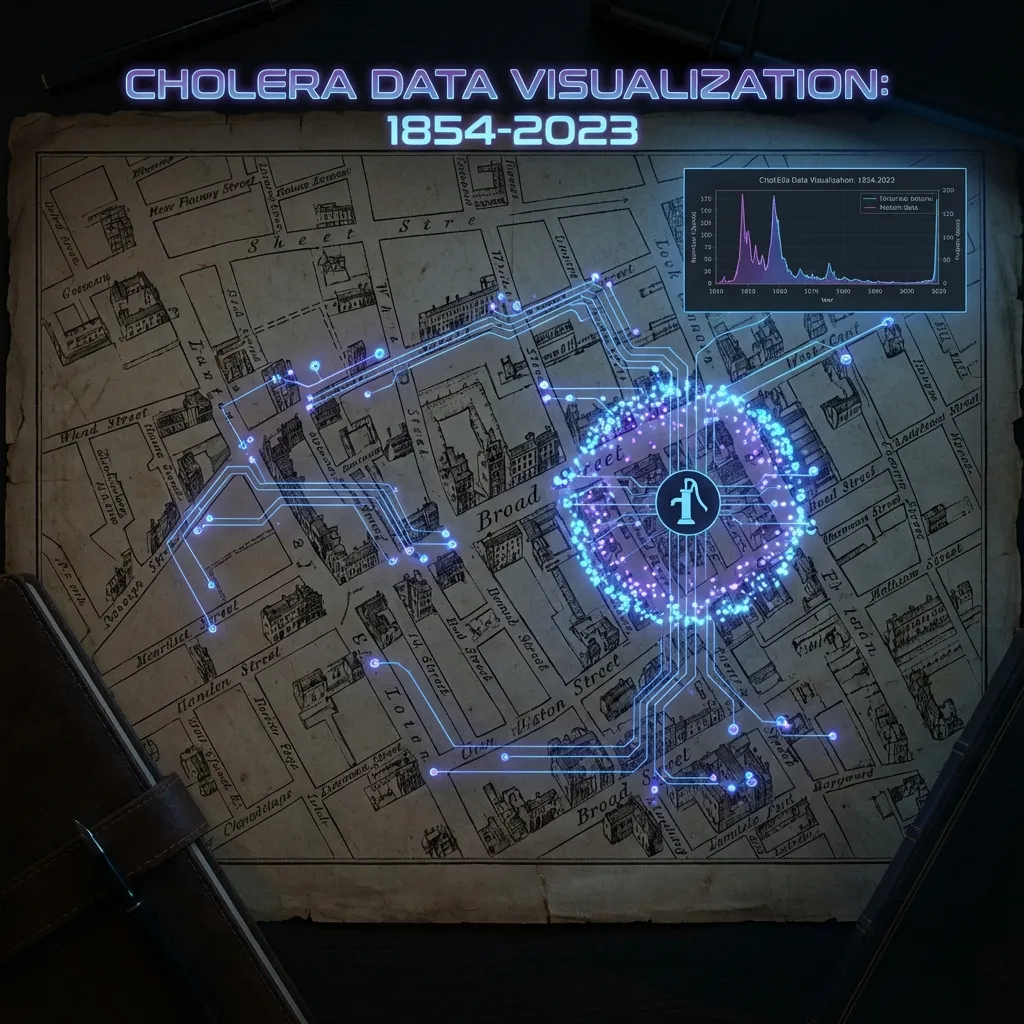
Ignoring common sense, he started knocking from door to door. He didn’t just see patients; he saw data. Snow drew a map of the neighborhood and marked each death with a black bar.
As the ink dried, an invisible story revealed itself: the deaths clustered, dense and dark, around a single point on Broad Street: the public water pump.
Snow didn’t need a microscope. He needed context. He understood that those dots on the map weren’t just statistics; they were his neighbors, drinking from the same poisoned water. He convinced the city council to remove the pump handle. And the epidemic stopped.
The Bridge: From Ink to Pixels
John Snow was the first “Human-in-the-Loop” data scientist. He practiced what we at Centrato call Quantitative Empathy.
Fast forward 170 years. Today, we don’t use ink and parchment. We use Python and Data Lakes. Our maps don’t show London streets, but complex neural networks of human behavior.
But Snow’s lesson has never been more urgent.
We live in the era of Big Data, where abstraction is the norm. We transform people into “datapoints”. A single mother becomes a “credit score: 540”. An elderly patient becomes “claim risk: high”. A job candidate becomes “cultural fit: 30%”.
The New Contaminated Water: Algorithmic Bias
When we remove humanity from data, we create the digital version of the Broad Street contaminated water: Algorithmic Bias.
Imagine an HR algorithm trained on 10 years of resumes from a mostly male company. It learns, mathematically, that “man” correlates with “hiring”. Without malice, but with ruthless efficiency, it starts discarding qualified women.
For the algorithm, it’s just pattern optimization. For society, it’s the perpetuation of a historical injustice.
If John Snow were an AI model trained on 1850 data, he would probably confirm that “poor people die more”, correlating this with “living in dirty streets” (miasma), and not with the water. He would lack the human intuition to question causality.
The Call for Quantitative Empathy
Technology gives us the power to process billions of data points. But ethics demands that we remember what each point represents.
Quantitative Empathy is the ability to look at a dashboard and feel the weight of the reality behind it.
- It’s understanding that a “false positive” in a police facial recognition system isn’t a statistical error; it’s an innocent citizen arrested.
- It’s seeing that a “food desert” on a retail map isn’t just a lost market opportunity; it’s a public health crisis.
As leaders and data professionals in 2025, we have a choice. We can be like the Victorian authorities, blaming the “miasma” and blindly trusting models we don’t understand. Or we can be like John Snow.
We can have the courage to look closely at the data, dirty our shoes in reality, and find the handle that needs to be removed.
AI is the tool. Empathy is the map.